Adding Chart Widgets
- In the Edit Mode tab of the Dashboards Building Interface, click the “add a widget” button.
- Choose the type of chart you want to utilize. You can choose between a Pie, Donut, Bar, Line or Scatter chart.
- In the top left corner , double click on Untitled widget and provide a name for the selected chart widget.
- Choose a data source: Tables, Case Management Tables or Case Management Reportings and proceed by selecting the specific table column from the data source you would like to use.
- Next move on to configure the selected Chart Type in the sections discussed below.
Chart Types and Configuration
- Pie
- Donut
- Bar
- Line
- Scatter
Pie Chart Data Configuration
INFOThe data used to configure the
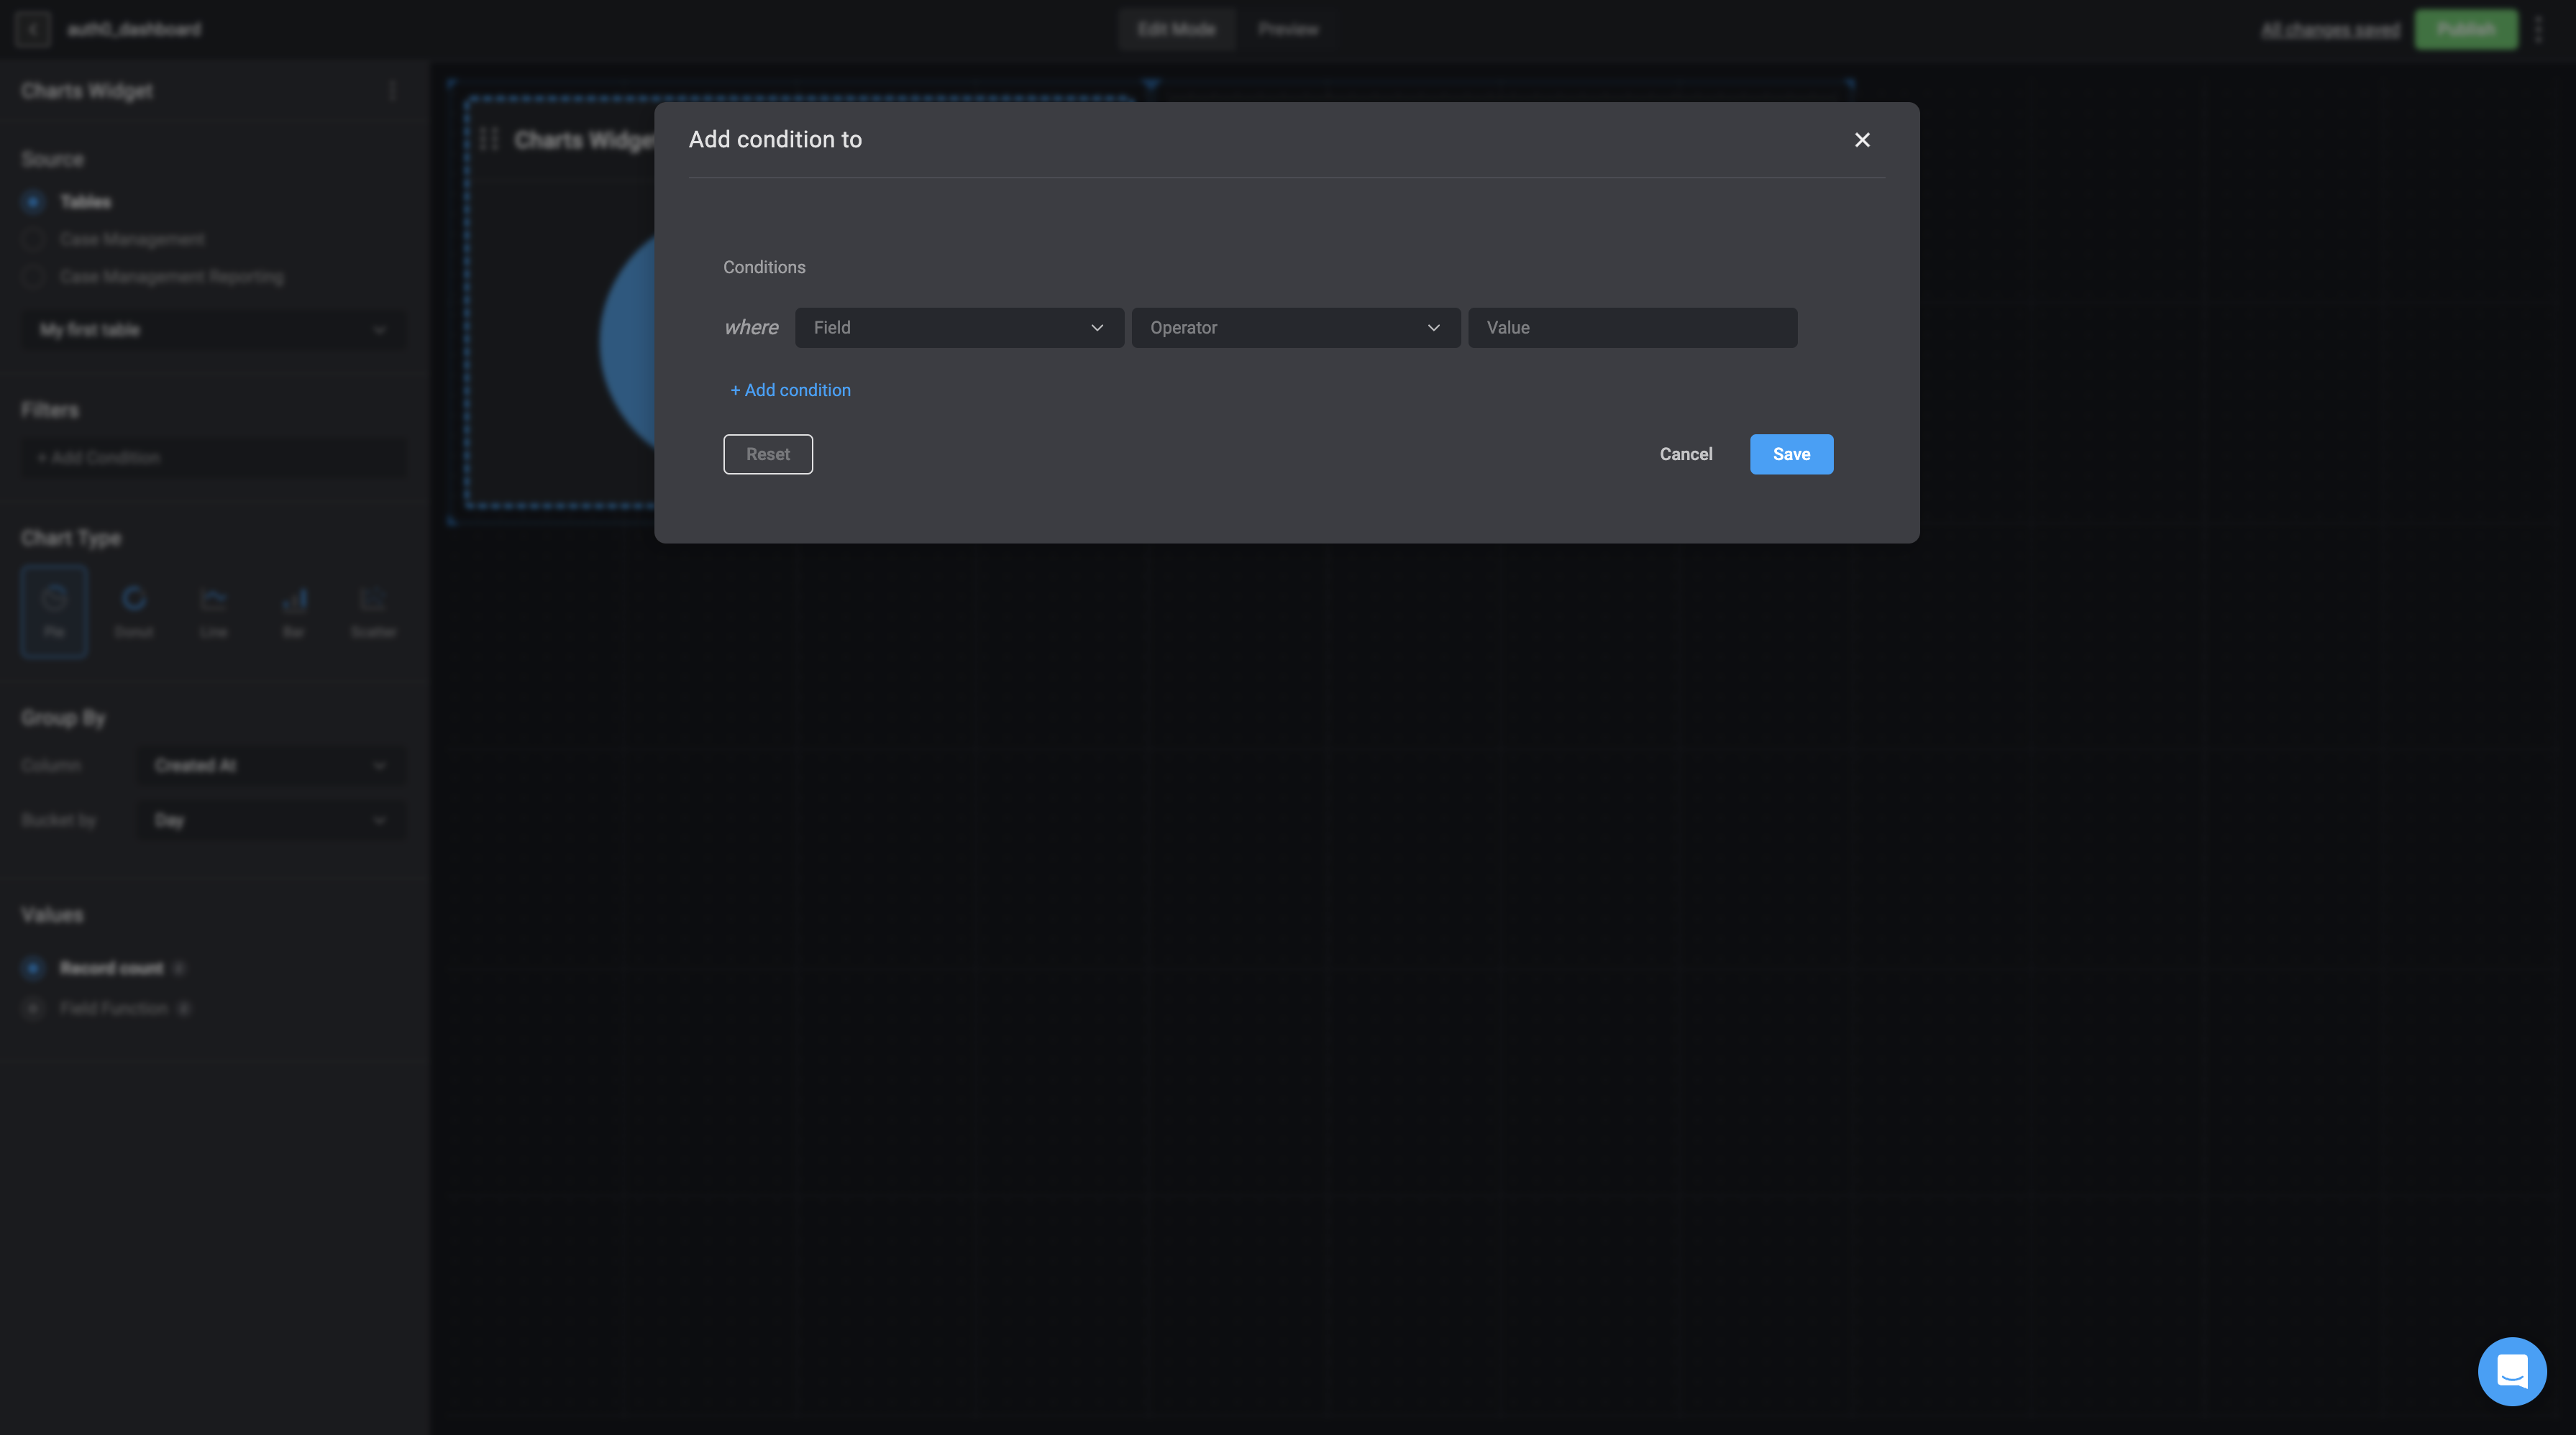
pie chart will be taken from a particular table from the tables feature or case management feature.As a reminder, chart elements can expose raw data that may be sensitive, and therefore should not be used if you have concerns with viewers being able to see that information.- Optional- Under the Filters section, using the [condition builder]condition builder, you can set specific records by condition(s) to filter the underlying data.
-
Underneath the Group by section:
- Next, choose the table column you want to group the
pie chartby. If the selected column is a time period, you will see the Bucket by option, allowing you to categorize the time period. This will be shown as a legend on the right side of thepie chart.
- Next, choose the table column you want to group the
-
Underneath the Values section:
- If you select Record Count:
- The Chart widget will show the total number of records available in the chosen source table.
- If you select Field Function (You can only add a Field Function if the selected column is a numeric value).
- Choose a column:
Time from Status Open to Status,Time in StatusorTime to Assign - Choose the sum operation that will be used to calculate the selected column values:
Sum,Maximum,Minimum,AverageorMedian.
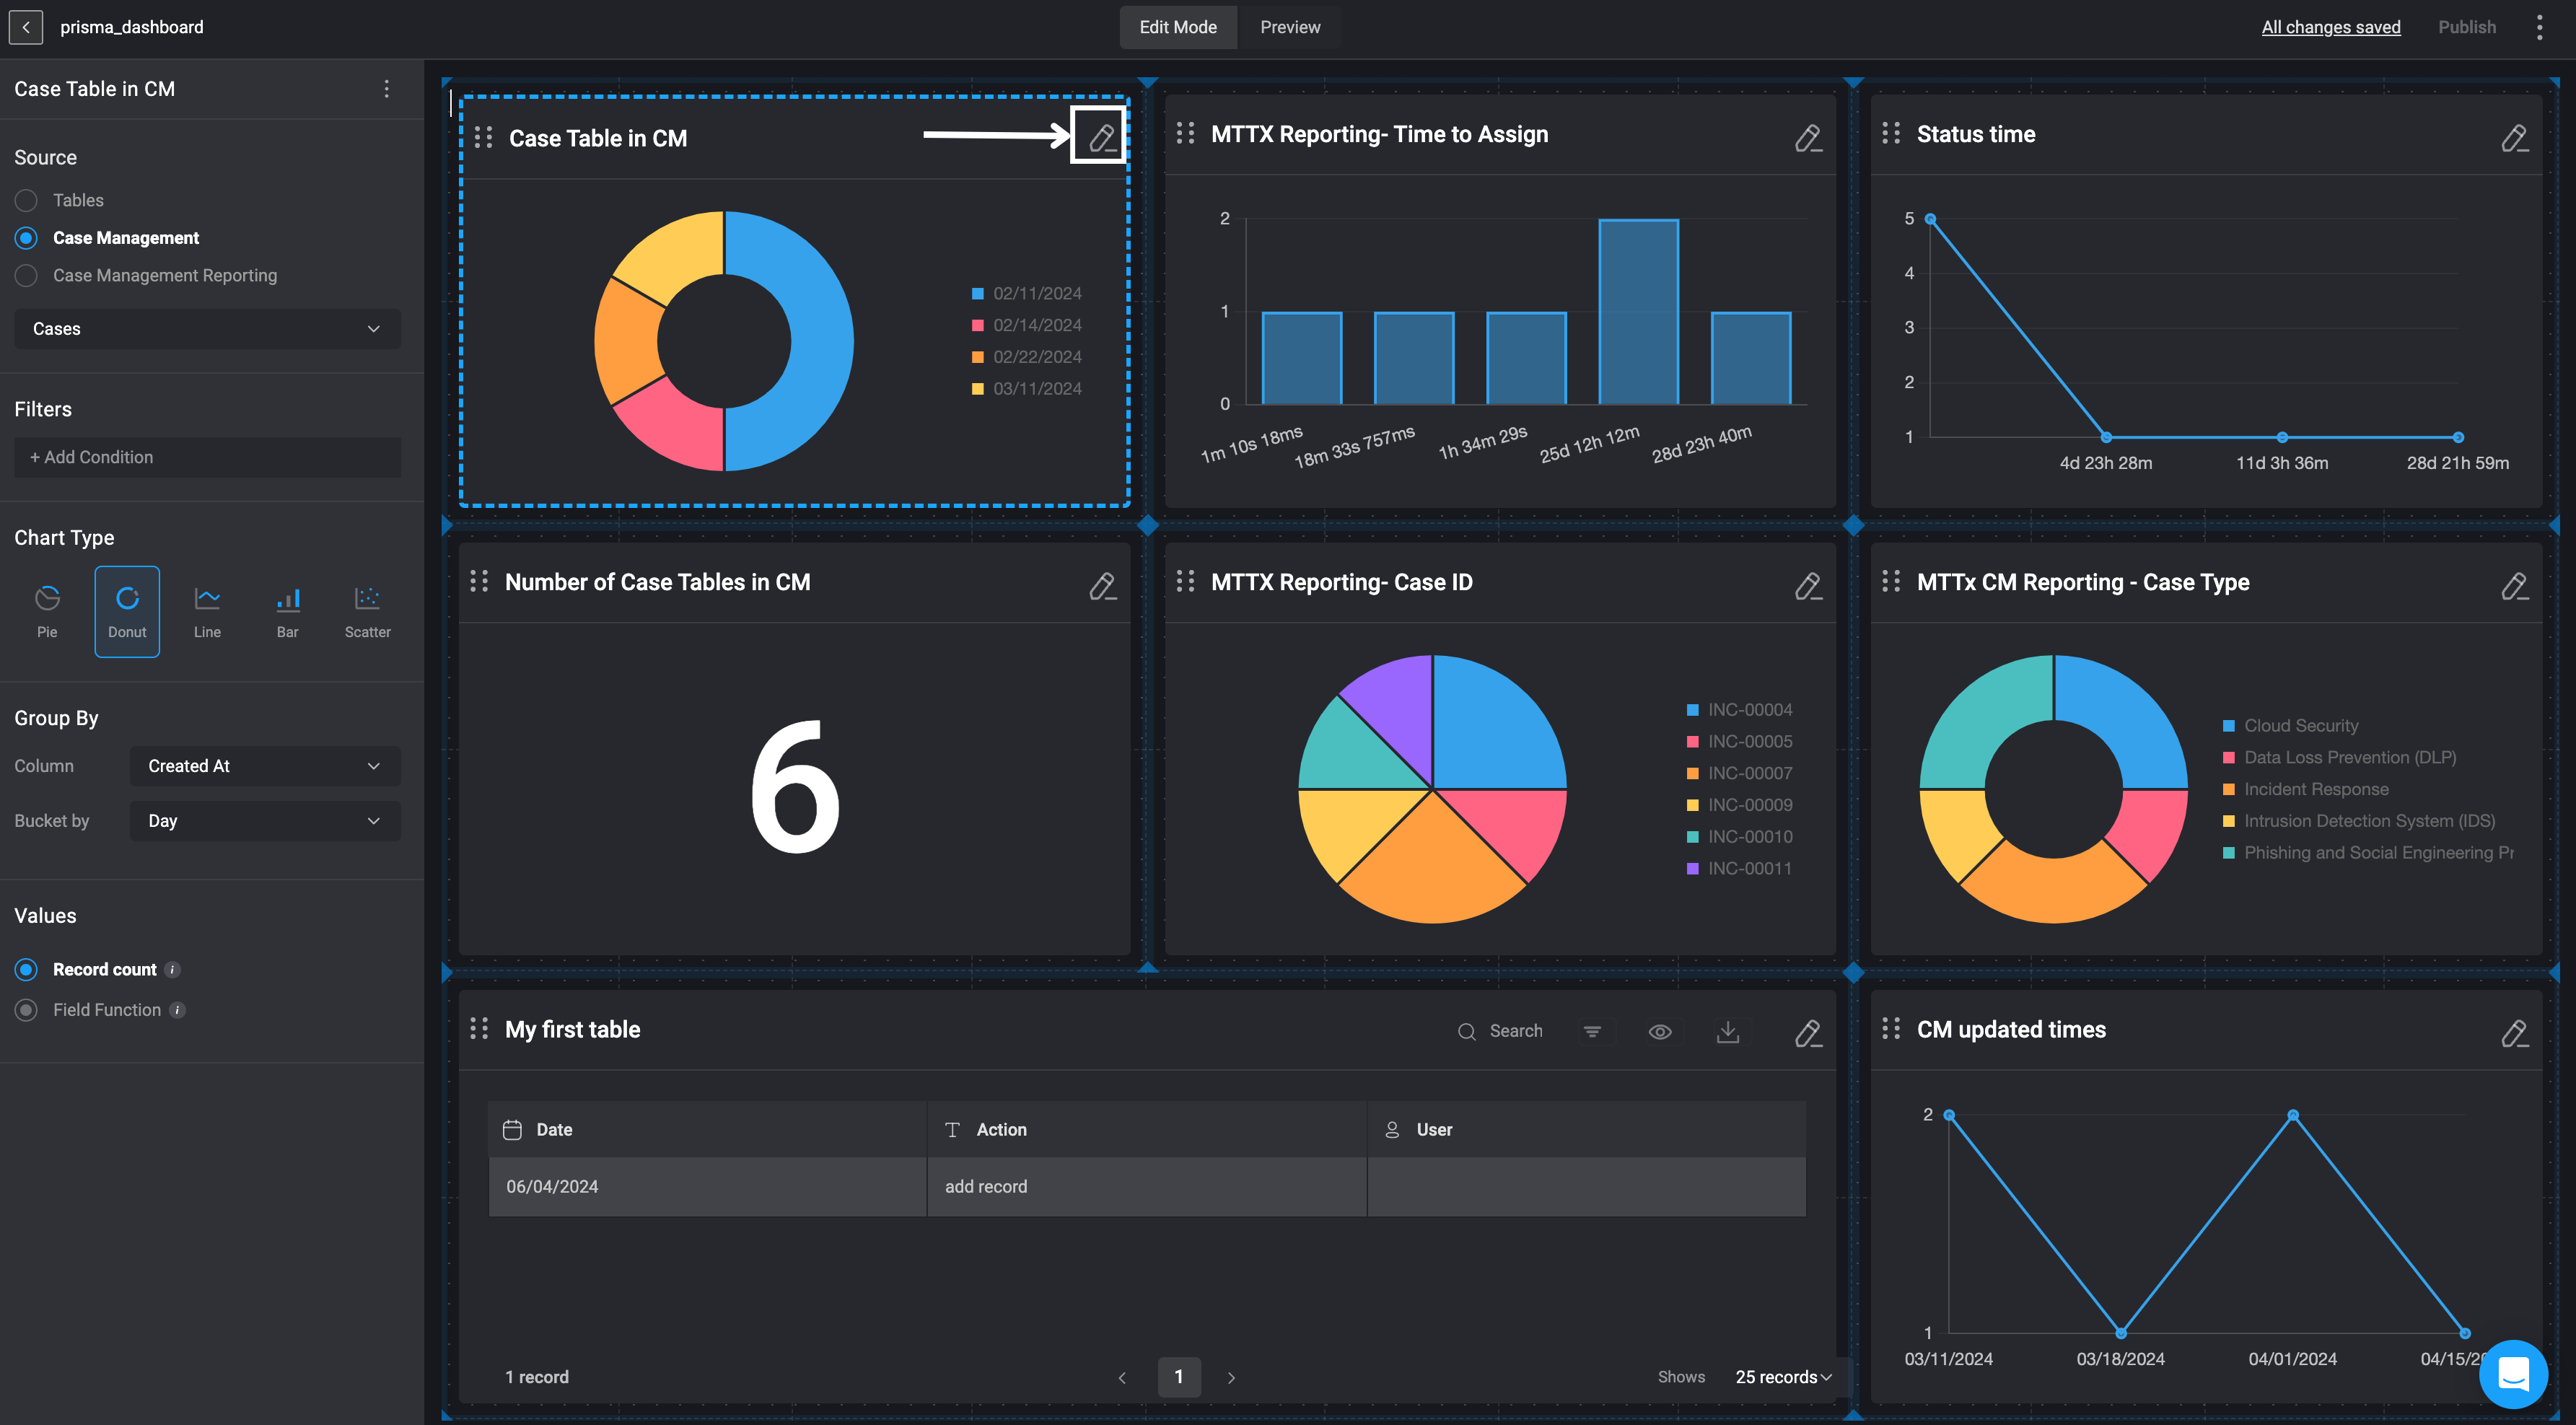
Editing a Chart Widget
- In the top-right corner of the selected chart widget, click on the pen icon, and then continue to make any desired changes in the left-hand side bar. Any changes you make will automatically be applied to the Chart Widget.
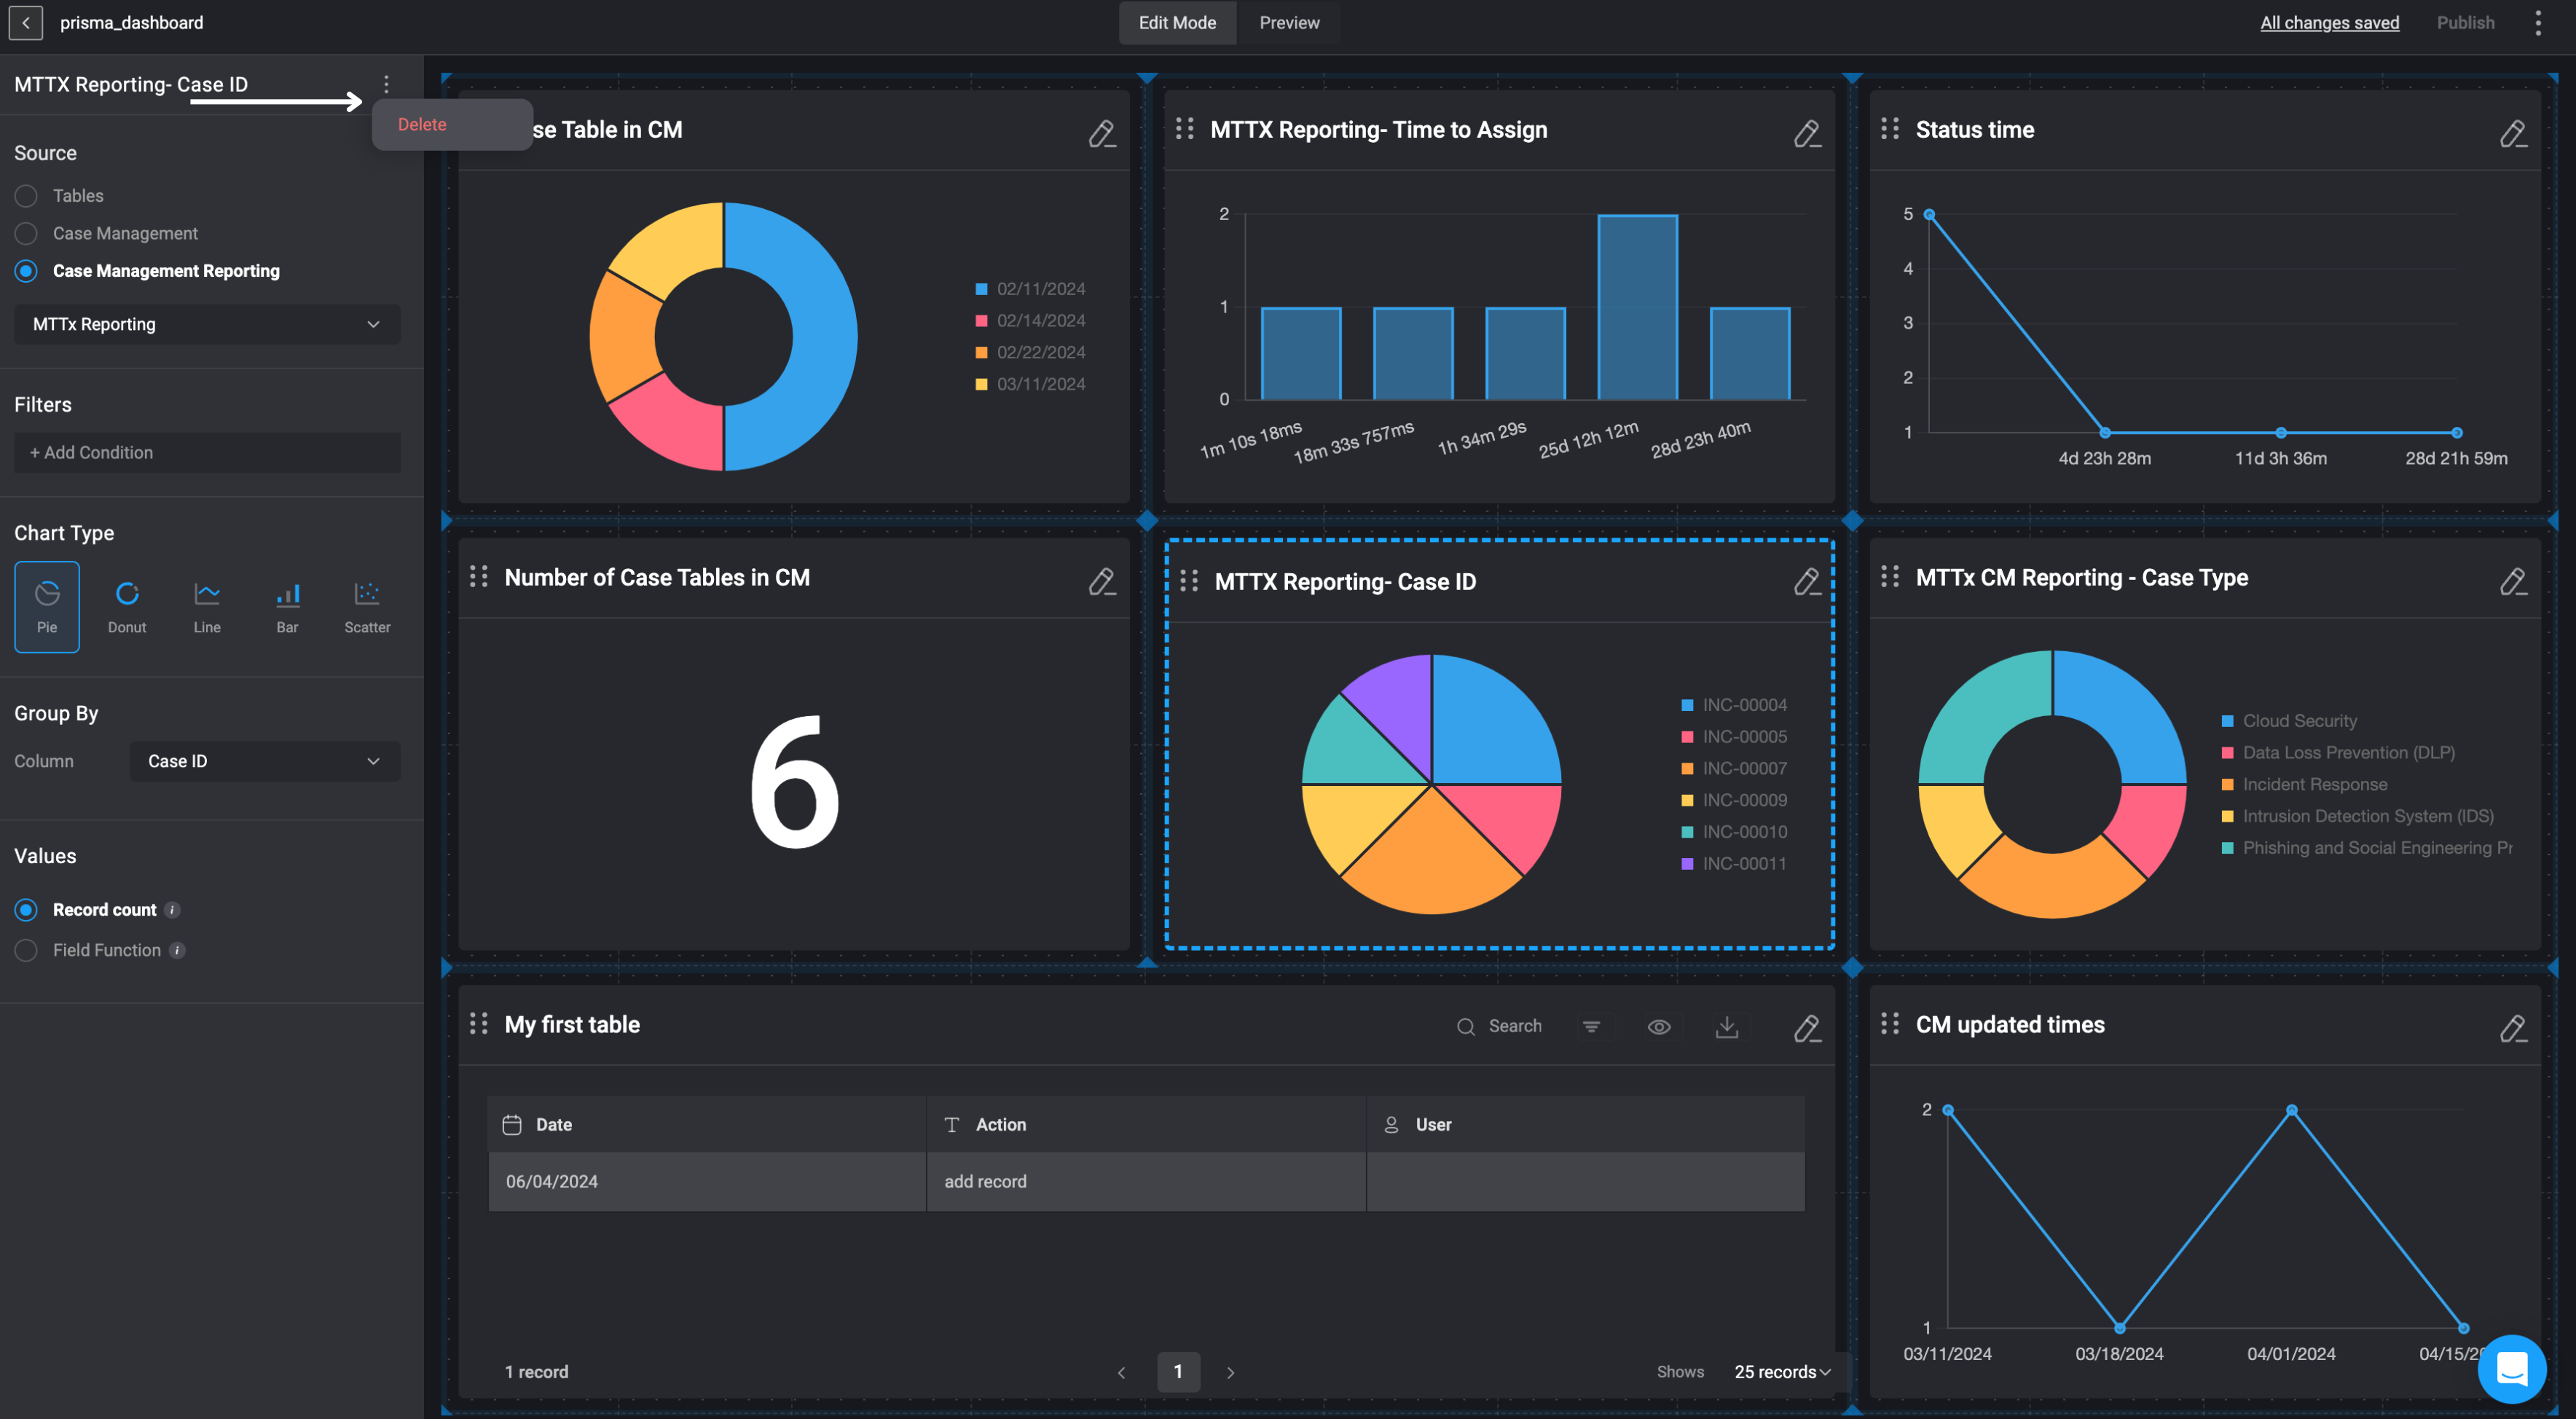
Deleting a Chart Widget
-
In the top-right corner of the selected Number widget, click on the Pen icon, then in the left-hand sidebar, click the icon in the top-right corner and then select the delete button.
- The Chart Widget will be removed from your your Dashboard Building Interface.